
TL;DR
As token engineers, our goal is to understand how different elements of token unlock design – namely the size, frequency, length and distribution of unlock – impact a token’s price stability and long term health.
We collected and analyzed data on over 5000 different unlock events and identified the following insights:
- Small unlock events, those that increase circulating supply by 0% to 1%, had no meaningful relationship to price.
- Larger unlocks, those that increase circulating supply by greater than 1%, correlated to a noticeable, negative relationship: as unlock size increased, prices decreased.
- Tokens that have vested most of their supply (more than 70%) had both substantially lower volatility and higher relative prices than tokens early in their vesting periods.
- Protocols with a higher than average allocation to private groups (e.g. team, investors) than public groups (e.g. ecosystem, community) showed modestly better performance. The results, however, in our view weren’t meaningful enough to be a primary consideration for token engineers.
From these insights we derived three considerations for founders, which are briefly summarized below:
- Consider sizing unlocks to be no larger than 1% of the circulating supply. Bias towards daily or weekly unlocks instead of quarterly or annually.
- Rethink the inclusion of a large vest cliff. Such events can create significant and unnecessary price pressure.
- Be aware that token price may be substantially more volatile in the first half of the vest schedule.
We posted our data and analysis to Github [link] and encourage token designers to submit additional tokens to the database and contribute new analysis methods to further understand unlock design choices.
Goals
The impact of large token unlocks, although present in virtually every funded project, is an understudied element of token design. These unlocks can create substantial volatility [1] and consternation for communities, token designers, and traders.
However, when done correctly, token unlocks help align incentives between stakeholders. So what is the best approach? We dove into the data to understand how token unlocks have historically influenced price movements and overall protocol success. Can we glean generalizable principles from the data? How can founders act on these insights?
Our goal was to understand if there are generalizable insights on how different elements of unlock design – size, frequency, length and distribution – can impact a token’s price stability.
We hypothesize that larger unlock events will have a greater negative impact on price and that tokens which are mostly vested will outperform those that are mostly unvested (i.e. low circulating supply relative to max supply) since many token recipients will sell the token at unlock events.
Dataset
We collected and verified data with 20 protocols, including Uniswap (UNI), Galxe (GAL), and BitDAO (BIT), yielding over 5000 different unlocks to analyze. Data verification consisted of viewing on-chain data and/or confirming the token unlock schedules with protocol core teams. * % Vested is as of April 2023
The dataset represents a balanced spread of vesting schedule types, and market conditions:
Analysis
A natural starting point is to investigate the direct relationship between the size of token unlocks to the historical change in price as they occur. To first gain context on the general trends of the data, we gathered normalized price data for every unlock on one chart, plotting average and median lines. We look at one month of price data, a window of 15 days before and after the unlocks occur. On average, token prices were about 13% higher 15 days before the unlock, and rose moderately after unlocks occurred. The median line showed a stronger downward trend for prices after unlock, dropping another 5%. We attribute the skew between median and average to a few abnormal outlier events from extreme market events. Therefore, we believe the median is the better representation of the marginal unlock.
These results align with a basic economic intuition: if supply rapidly increases without proportional change in demand, prices should drop. However, the situation here is clearly more complex. Vesting schedules are generally public, introducing an opportunity for narrative building and event trading. More recently, some token unlocks have become bullish events [2] as a result of short squeezes. This anticipatory activity complicates the picture. Is there a way to mitigate it? Is it worth it to mitigate it??
Although this level of analysis confirms the natural intuition for how prices behave around token unlocks, we can apply more rigorous analysis techniques to mine stronger insights.
Correlation Analysis
Same Day Analysis
We start by analyzing the single-day change in price to assess the market reaction to an unlock. Below we plot the percent change in price (from the day before) against the percent change in circulating supply. In essence, this attempts to measure the relationship between unlock size and price impact. If our correlation shows a negative relationship, it implies that larger unlocks are associated with larger drops in price.
We classify two separate types of unlocks: private and public. Private unlocks include teams, collaborators, investors and advisors, while public unlocks include treasury, ecosystem funds, community distributions, and airdrops. In total, we collected 2187 public unlock events and 4546 private unlocks. In comparing private vs public unlocks, we find that public unlocks are small – more often under 2% of total supply – while private unlocks have a much wider range of sizes and impacts on price, and present a negative correlation. This makes sense, since unlocks to insiders generally include large events like cliffs and/or quarterly unlocks, where some insiders may sell upon receipt.
Isolating for private unlocks yields the following: A noticeable feature is the cluster of points between 0% and 1% of supply unlocked, indicating that there may be different relationships in different ranges for different sizes of unlocks. To investigate this, we separately observe unlocks between 0% and 1% and greater than 1%.
 For the first cluster (0% – 1% unlock), we find no linear relationship. This aligns with the intuition that small unlocks have a smaller effect on price, though one would still expect price impacts to increase with unlock size. Instead, it seems that any size of unlock within this range is generally similar in impact. We expect this is because small unlocks do not have any narrative that gets created around them, and are part of “business as usual.”
For the second cluster (1+% unlock), we see a stronger negative correlation, showing that prices decrease as unlocks grow in size. This aligns to our hypothesis, that larger unlocks result in larger price reductions. As there are several exogenous variables in token prices, we know not to expect high levels of correlation, but consider 16% meaningful for token price data.
Additionally, the role of macro cannot be omitted from our analysis. What if our data is largely driven by macro? We performed a number of analyses to understand the effect of macro and concluded that it was small enough to solely focus on changes to circulating supply**.
Longer Windows
A clear shortcoming of the single day analysis is the lack of price data before and after unlocks. We assume both anticipatory and reactive effects are present when token unlocks occur, which can sometimes take days or weeks to manifest. For example, short sellers may build positions in the weeks leading up to major unlock events, or insiders may take several days to exit positions due to low liquidity. To investigate this, we perform a similar correlation analysis on longer timeframes, including 3 days, one week, and 15 days before and after unlocks occur.
For the lead-up to unlock events, we calculate the change in price between the day of the unlock and the first day of the window. Therefore, the sign of correlation is inverted. Positive correlation implies that prices were higher before unlocks and negative correlation implies that prices were lower. If we assume our intuition to be true, we would expect positive correlations for the days before unlocks as anticipatory sell pressure causes drops in price leading up to the unlock. Similarly, we should see negative correlation for days after unlocks, as prices continue to drop.
Again, we found little correlation for unlocks between 0% and 1%. The lines of best fit are generally flat for both before and after unlocks occur, indicating that neither type of analysis reveals sustained price impacts for unlocks of this size.
The unlocks greater than 1% of circulating supply showed the following relationships:
As preliminary caveats, we strongly state that we can not prove causation rigorously, but instead present these results as evidence of a relationship for consideration and further study. Additionally, we limit our correlation analysis to a two week window since longer-term measurements will increasingly include unknowable or unmeasurable factors. Lastly, as windows increase in length, there may be some token unlocks that overlap, though we believe the impacts of these impacts are nominal*. With these caveats in mind, our results should serve as a helpful, evidence-based indication that prices generally tend to behave in a certain way around price unlocks.
At first glance, it seems that our hypothesis is supported by these results. Generally, the lead-up to unlocks presents positive correlations, indicating that prices were higher before the unlock. After unlocks occurred, we see negative correlations, indicating that prices dropped.
In both the 3-day and 7-day windows of time before unlocks occur, we see relatively strong correlations (24% and 23%) between prices and unlock sizes. Additionally, the 3 and 7-day periods after unlocks have -7% and -15% correlations. This indicates that up to a week before unlocks occur there’s stronger price pressure, most likely due to the anticipation of publicly known unlock events. On the other hand, our data fits much more closely to the regression line for the days after unlocks occur, indicating more confidence in this result.
For the 15 day window before unlocks, the correlation flips, becoming a weak -3% correlation. We filtered out all daily unlocks, examining only weekly and less frequent unlocks to reduce “cross-contamination” between unlocks. The lack of a result may indicate that the anticipatory effects are not as strong this far out, and instead are more often measured closer to the day of the unlock. In the 15 days after unlocks, however, the effect is the strongest of all of our windows at a -18% correlation. This indicates that while anticipatory effects may not begin 15 days before, the effects of eventual price suppression are present 15 days after.
Model Analysis
We cannot rely on empirical data for longer-term analysis since there are many exogenous factors over too long a time period. However, we can use Agent Based Models, which are closed systems with a discrete number of variables, to understand long term effects. More on how we built our ABMs can be found in a previous research article [3].
We modeled 3 different scenarios and a control. In the control, no tokens are distributed to institutional investors. We then introduce an institutional investor with 8% of the token supply for our experiments: tokens unlocking every other day, every month, and every 6 months.
 Overall, we find similar results to our empirical findings, indicating that larger unlocks yield larger and more sustained drops in token price. Over longer time horizons, we see greater divergence and variation of runs as unlocks become greater.
Correlation Summary
When looking at particular vest unlocks, we found that prices generally drop before and after unlocks occur, proportional to unlock size. We don’t aim to prove causation rigorously, as single-factor regression is insufficient when analyzing price data due to the complex and unknowable influences in markets and the inability to conduct side-by-side experiments.
Vesting Length
Our other intuition is that some recipients of tokens may sell upon receipt, meaning that tokens which are early in their vesting progress may experience greater, sustained sell pressure into a lower liquidity environment compared to those that are mostly or entirely vested.
To assess this, we grouped our dataset into two buckets: tokens which are mostly vested (>= 70% vested) and mostly locked (<70% vested). We chose 70% because it provided us a balanced dataset of 9 tokens in mostly vested and 11 tokens in mostly locked.
It should be noted that these tokens fall into these categories as of publishing, so we examine a recent period of time to measure their performance in their current percent vested status. We look at 4 months, from January 15th to April 15th of this year. To measure performance, we focused on two metrics.
-
Average Variance. Instead of using variance or standard deviation, we use the coefficient of variation, a measure that divides the standard deviation by the mean. This allows direct comparison of volatility between assets without the skewing effects of varying token prices. In essence, we measure how much spread and volatility occurred in token prices over the time period.
-
Average price change. Percent difference in price from the beginning of the time period to the end. We use this to understand how tokens performed when compared to the market.
After running the same metrics for Bitcoin and Ethereum, we found the following:
The two groups have strongly divergent behaviors. The mostly vested tokens map much more closely to ETH & BTC, meaning that they essentially move according to the market. For mostly locked, however, we see that they have substantial price reduction over the same time period and also have 2.6x more variance than the mostly vested tokens. Clearly, tokens that have already vested most of their tokens are far more stable and appreciated more in value than tokens that are still vesting their tokens. This confirms our hypothesis that tokens become more stable in price once most of the tokens are unlocked. We believe this is because tokens have moved into communities & investors that have greater long-term belief in the protocol.
Token Distribution
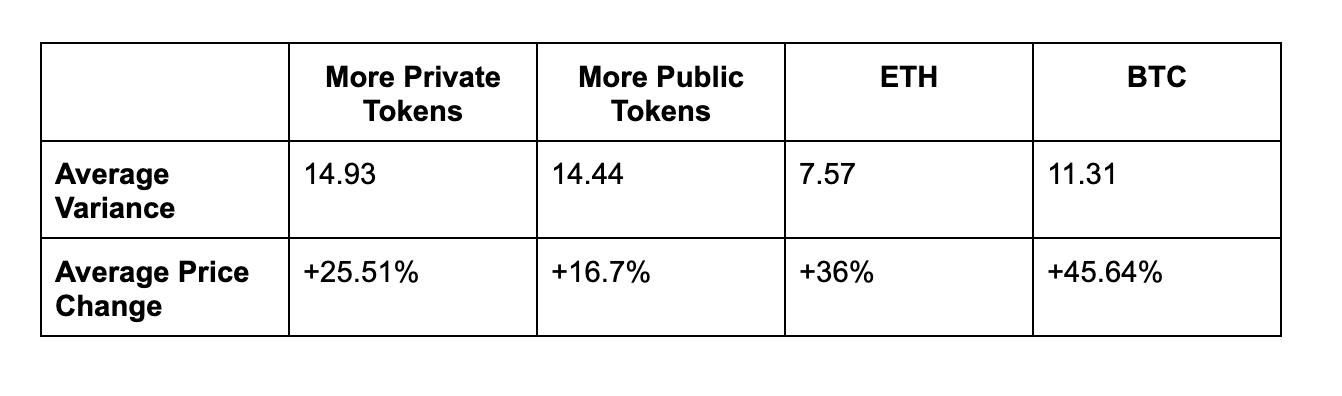
As shown in our summary statistics, the average distribution of token allocations was 63% public and 37% private. We grouped our 20 tokens into two buckets – “more public allocation” (8 tokens) and “more private allocation” (12 tokens), and then ran a similar analysis as above.
Our hypothesis was that tokens with more private allocations would experience more volatility because of the narratives built around large, private unlocks, and specifically from ‘insider dumping’. After running the same analysis, we found the following:
January 15th, 2023 – April 15th, 2023
 October 1st, 2022 – January 1st, 2023
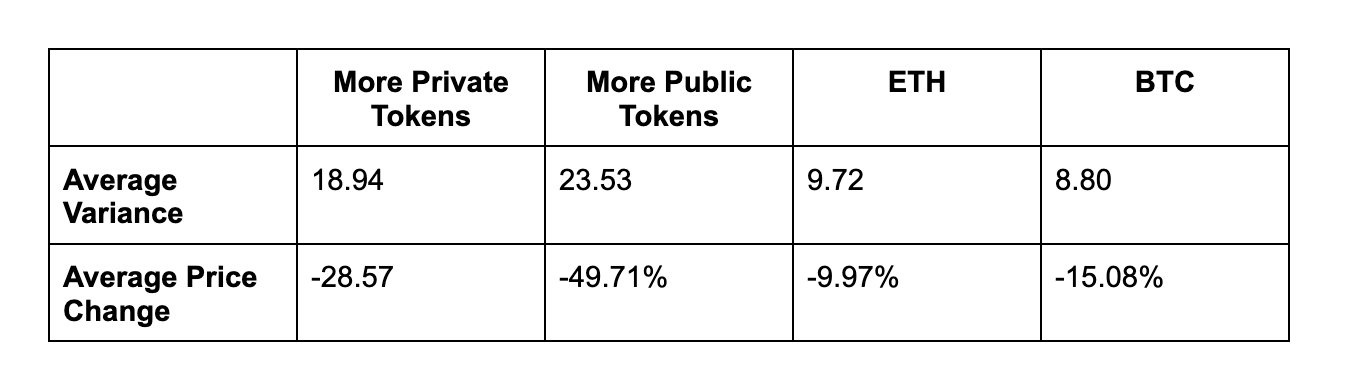 Interestingly, private tokens fare slightly better in both volatility and price performance over both time periods. This could be because some private token holders utilize OTC services to buy/sell tokens without moving price, and these services are generally not available to the community (i.e. retail participants). However, these results aren’t strong enough to create a strong recommendation around token distribution. As a general position we always favor strong community distribution of tokens and believe communities are vital to healthy protocols and the crypto industry more broadly.
Summary and Best Practices
Overall, our empirical and simulation findings show similar results. Unlocks greater than 1% of the circulating supply show a negative relationship between unlock size and price. Interestingly, for smaller unlocks, the effects are essentially nonexistent. We also found that protocols which are mostly vested more closely tracked the market and outperformed those tokens which were early in their vest cycles. Lastly, tokens with higher private distributions experienced marginally lower volatility and better price performance than those that are skewed more towards public distribution.
These results lead to some natural conclusions for founders.
-
1% Rule: Founders looking to reduce token price volatility should aim to unlock smaller token amounts in relation to circulating supply. Our data suggests that unlocks under 1% of supply had no correlation to price impact, meaning block-by-block, daily or weekly schedules may be preferred over quarterly & annual unlock events. Another notable benefit of smaller, more frequent unlocks is that potential sell pressure is more evenly distributed and not concentrated at large events.
-
Rethink the Cliff: We observed the strongest price decreases leading up to large cliffs. In some cases, these result in 20% price reductions, taking up to 2 months to recover, if ever. Minimizing large events, especially cliffs, helps to remove any reinforcing negative narrative as well as unhealthy leveraged trading behaviors. Instead of taking cliffs as default token design, founders should consider the ramifications of unlocking a year’s worth of tokens at one time. U.S. based teams may need to delay vesting for 1 year to remain compliant with existing regulations. To maintain this objective, teams could begin vesting at the 1 year mark instead of unlocking 1 year of tokens in one event.
-
There may be elevated volatility and price suppression early in the vest schedule cycle: Founders armed with the knowledge that tokens which are ‘mostly vested’ will likely outperform those that early in their vest schedule will be able to communicate expectations to investors and communities more effectively. In addition, founders might consider designing vest schedules to more quickly reach the state of ‘mostly vested’ than elongating vest schedules over long periods of time. However, there is no analysis that can meaningfully determine the optimal token vest length since over long time periods there are too many exogenous factors.
We are eyes-wide-open that some of these insights benefit insiders – team and investors. This was not our intention. In the interest of transparency and community we open sourced the dataset [4] and encourage the community to A) contribute protocol vest data to the dataset and B) run different analyses to help reinforce or disprove the initial insights.
We are early in our journey and look forward to collaborating further with the crypto community.
* Our objective is to isolate the multi-day impact of single unlock events. However, we found that performing window analysis presented the challenge of handling overlapping events, since many protocols have at least one recipient unlocking on a daily vest schedule even if the rest are on less frequent unlock schedules. For example, even if Team & Advisors unlock monthly, the Ecosystem Fund or Treasury may unlock daily. If there are daily unlocks within the analysis window, technically the relationship is no longer measuring a single unlock event. We reconcile the in-cases overlapping unlocks by our insight that smaller, daily unlocks do not have a measurable relationship to changes in price. With this taken into account, we felt that the window correlation analysis is still valuable.
** We explored the effects of macro in three ways. At a high level, we confirmed that our unlocks are from bear and bull markets roughly equally: 47% bear and 53% bull. We also ran a multiple regression with three factors – supply changes, token price changes, and macro prices – price changes showed less than 4% correlation to macro price changes. Lastly, we removed market betas from our price data and ran our analyses with adjusted prices. We found no meaningful change in our results.