
Airdrops have been a common but understudied part of token generation events (TGE). The mechanism is simple – distribute freshly minted tokens to the right wallets to help establish an initial float, enable on-chain governance, power transactions, reward early contributors, and potentially attract new users.
We believe that such a ubiquitous element of token design should be quantitatively studied to determine best-practices. We collected data on over 2 million airdrop events across 40 protocols and analyzed the two most important choices that token designers face:
- How much of the supply should I airdrop?
- Who should be eligible for my airdrop?
We use several different approaches to answer these questions, including price performance, volatility, and wallet activity. Our analysis and datasets are publicly available and we encourage contributors to help grow the data set and analysis.
Dataset
Our final dataset includes 40 airdrop events from 40 protocols and the activity of 2,098,698 unique wallets. Note, we specifically only used airdrops from 2023 and earlier.
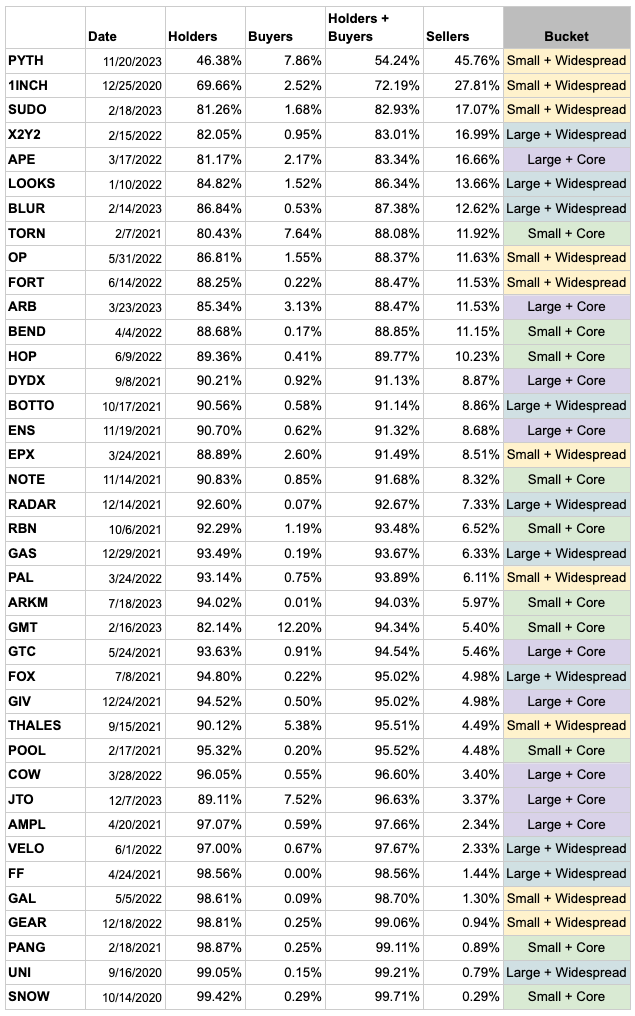
Events for the the following 40 tokens were analyzed:
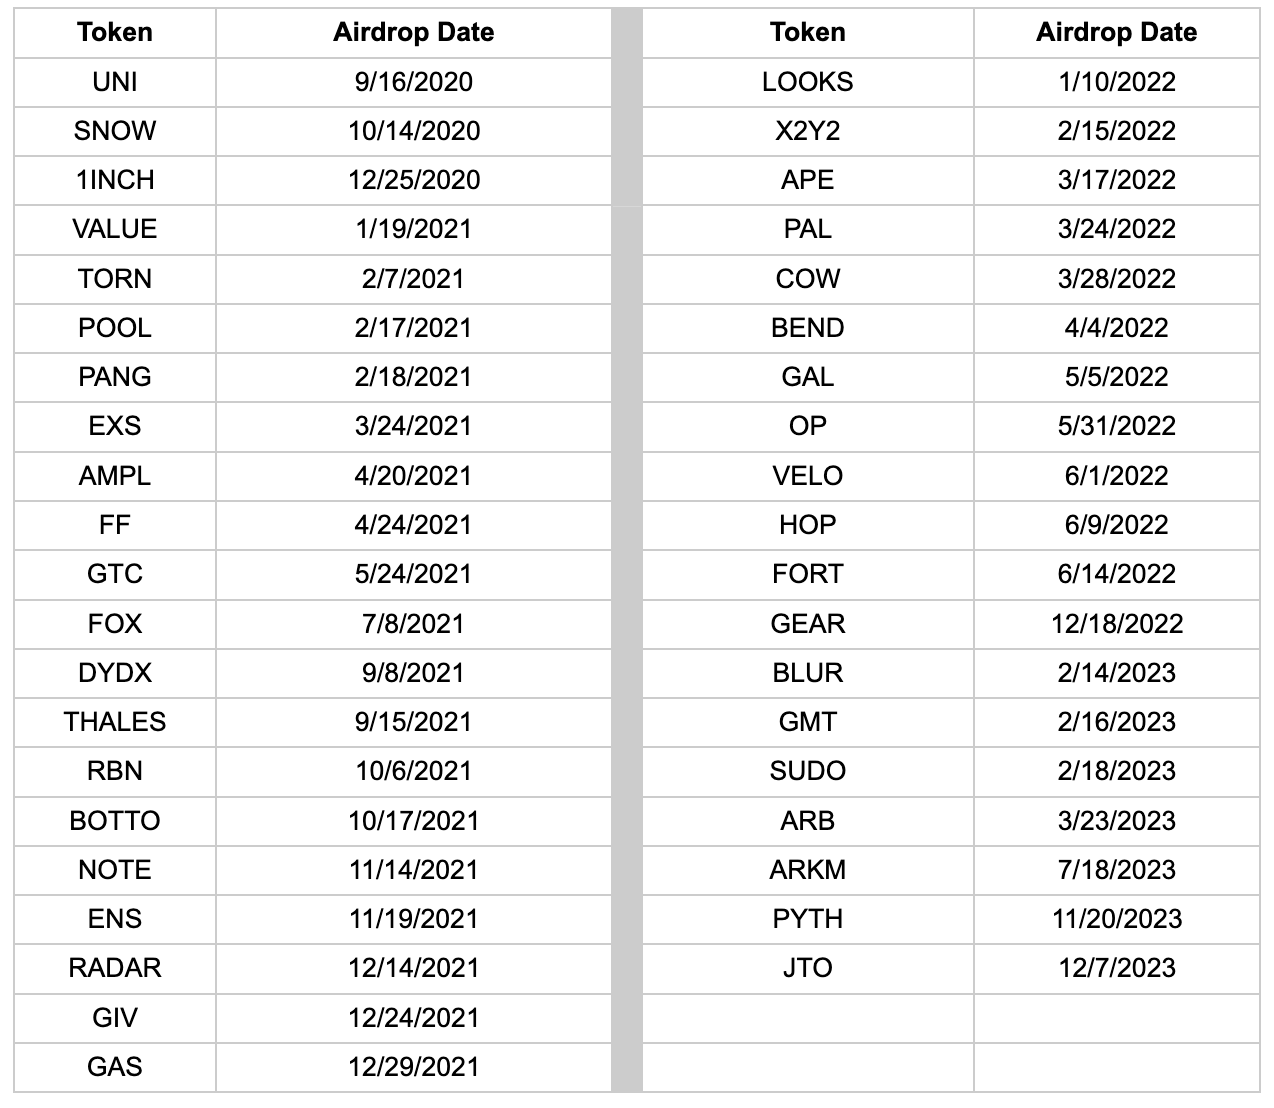
For each of these protocols, we focus our analysis on the previously mentioned metrics: Eligibility Type and Airdrop Size.
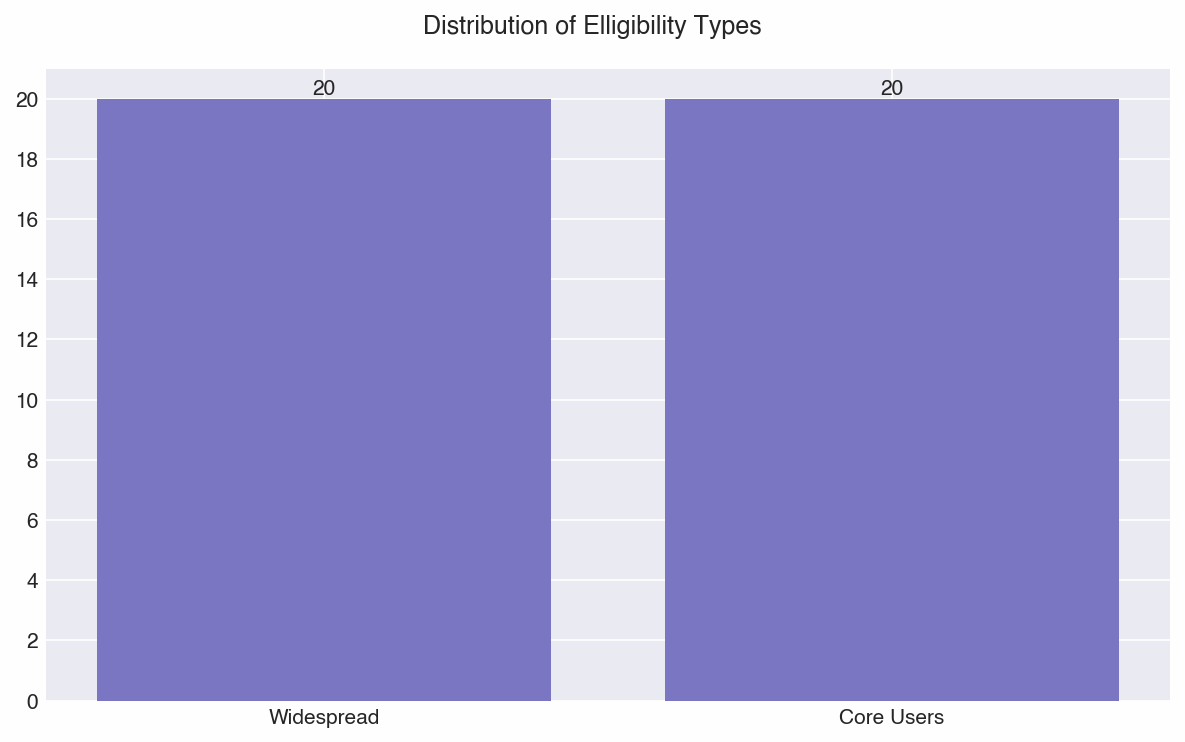
Eligibility Type
‘Eligibility Type’ is categorized as either “widespread” or “core users”. In the former, protocols airdrop tokens to general ecosystem users, e.g. a new DePIN protocol airdropping to wallets that have engaged with other DePIN protocols in a fixed timeframe, or to specific on-chain communities (e.g. NFTs). In the latter, protocols only reward users that have engaged directly with the protocol pre-token. Fundamentally, these approaches distinguish between two choices: should the airdrop primarily be a marketing and growth tool, or should it focus on rewarding those who were most active in bootstrapping the protocol?
Airdrop Size:
Another key element is ‘Airdrop Size’, or the percent of total supply allocated for the airdrop. The motivation here is simple: is there some “optimal” range of airdrop sizes?
Our dataset’s allocation sizes fell along the following distribution:
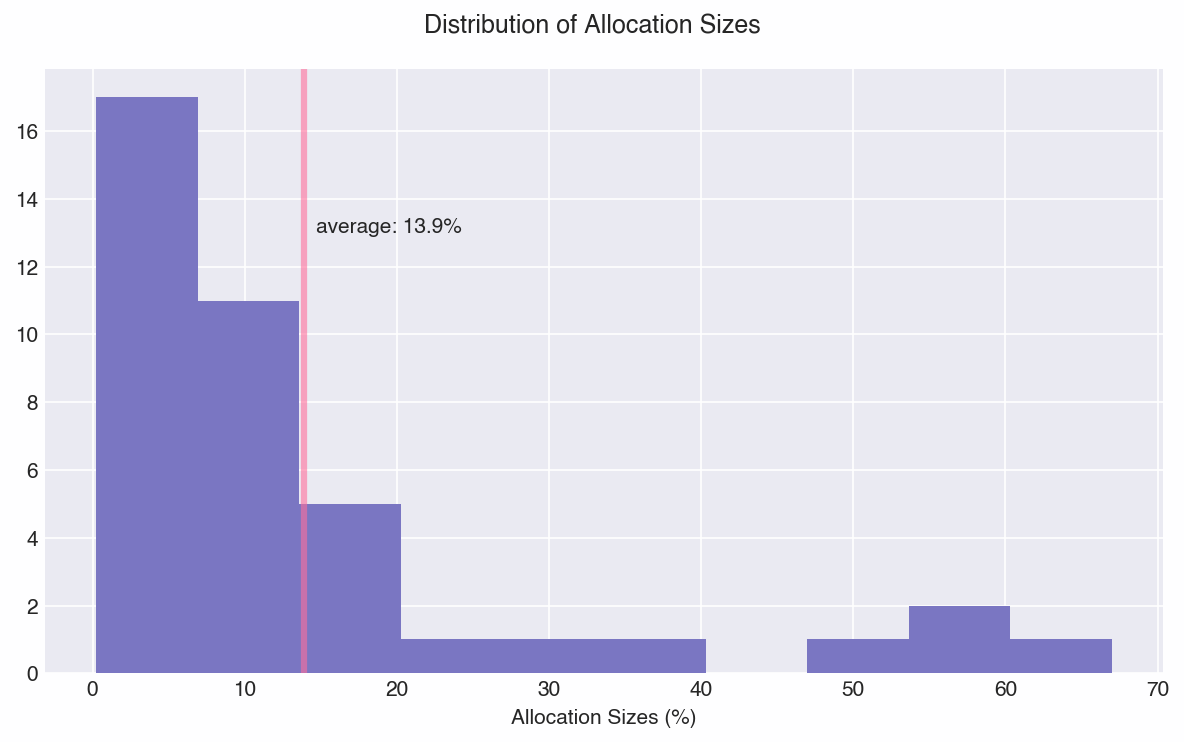
The median allocation size was ~10%, which gives us relatively even buckets of 19 small and 21 large airdrops.
Categorization
The goal of categorizing the events is to compare holistic design choices. To do this, we organize our events into 4 different combinations:
|
Less Than 10% Supply Airdropped |
10% or More of Supply Airdropped |
|
|
Core Users |
GMT, ARKM, BEND, HOP, NOTE, PANG, POOL, RIBBON, SNOW, TORN, VALUE |
JTO, AMPL, APE, ARB, CoW, DYDX, ENS, GTC, GIV |
|
Widespread |
PYTH, 1INCH, EPX, FORT, GEAR, OP, PAL, GAL, SUDO, THALES |
BLUR, BOTTO, RADAR, FF, GAS, LOOKS, FOX, UNI, VELO, X2Y2 |
Analysis and Insights
As an initial caveat, our analysis aims to strike a balance between rigor and insight – causative links are difficult to prove using only price data or wallet data, especially in multi-factored environments like token markets. We can observe that certain design combinations performed better than others, but we do not claim to show rigorously that they performed better as a result of those design choices. We argue that it is plausible that some combination of factors, but especially Airdrops, create differences in average price performance between buckets.
Price and Volatility Effects
One important measure of Airdrop efficacy is the price impact. We aim to measure the price effects within a window that we deem is plausibly affected by the Airdrop. Because a majority of Airdrops occur at TGE, there are several confounding factors in analyzing price data.
We collected price data for two months after airdrops, normalized by a crypto index (see Appendix), and calculated percent change in price. Note that our starting price is based on 24hrs after the Airdrop, so we allow for some initial price discovery (i.e. immediate sellers).
Table: Price Changes post Airdrop
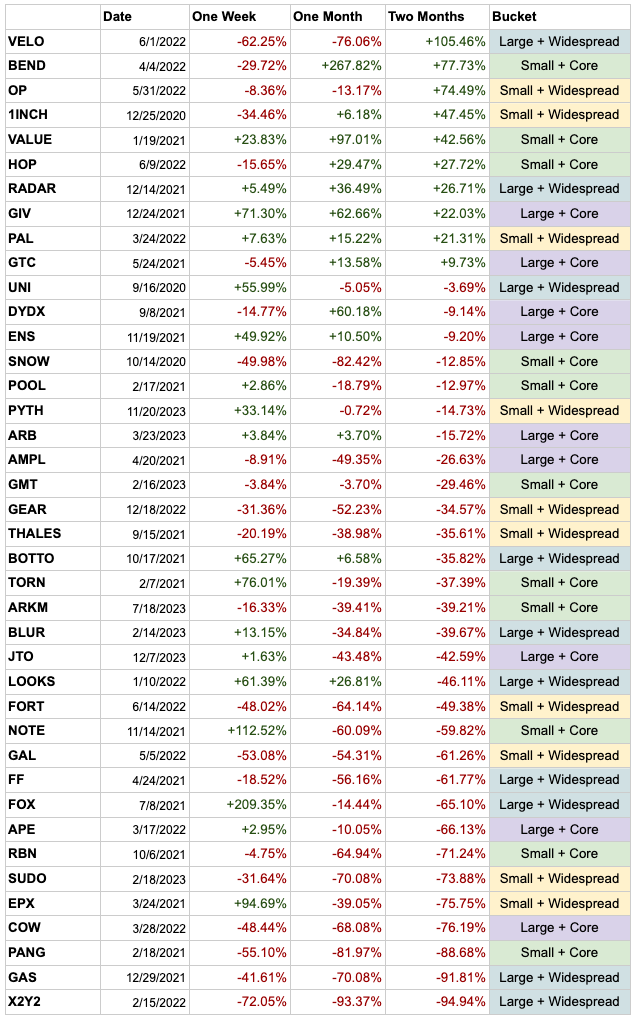
Only ten of the forty airdrops had a higher price two months after airdrop. Although we see a wide range of performance, when we measure across the four categories (chart below), they all converged towards a 10-40% decrease in price after 60 days. This is consistent with what we also observed for large cliffs in our Token Unlocks piece. Large anticipated token distribution events (greater than 1% of token supply) typically create selling pressure and stabilize lower after some time. That effect is most likely magnified with the buildup to airdrop events.
Aggregated 60 Day Price Performance
|
Small + Core |
Large + Core |
Small + Widespread |
Large + Widespread |
|
|
Avg. Price Change |
-14.21% |
-23.40% |
-18.09% |
-30.45% |
|
Median Price Change |
-28.81% |
-14.47% |
-36.05% |
-44.64% |
|
Avg. Volatility |
39.51 |
22.87 |
31.31 |
59.25 |
|
Median Volatility |
37.63 |
22.83 |
26.06 |
59.69 |
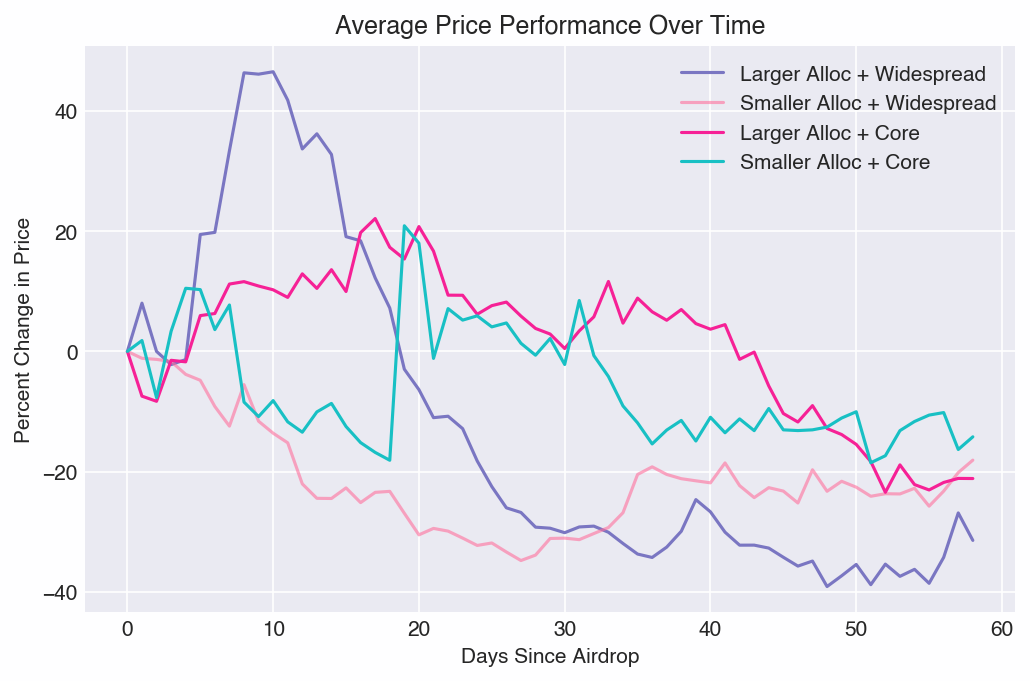
A few interesting insights can be drawn.
- The Large + Widespread cohort performed worst across price performance and volatility
- In aggregate, Core cohorts demonstrated better price performance and volatility than Widespread cohorts
- Airdrop size does not conclusively affect price performance or volatility
In addition, four protocols airdropped a majority of their supply. Their tickers are DYDX (50%), GAS (55%), VELO (60%) and AMPL (67%). We’d expect a correlation between airdrop size and price, but none was observed, either across this group, or when correlating Airdrop Size vs Price Performance across all tokens (not shown). That said, what the lack of correlation shows is that teams could airdrop a majority of their token and still have positive price change two months after launch (VELO +105%).
Wallet Behavior
Another valuable heuristic for measuring Airdrop success is understanding what users do with their received tokens. For each protocol, we analyzed the wallets of claimants in the 60 days following the airdrop. Note that for complexity, we do not account for the scenarios in which users transfer their tokens to other wallets or swap them outside of DEXs (e.g. send to centralized exchange). Tracking deposits to centralized exchanges becomes infeasible at scale, and we propose that only using data from DEXs provides a useful proxy for comparative analysis, most likely acting as a floor for % sellers.
Generally, we categorize users into three types: sellers, holders, and buyers. To perform this classification, we calculate their net change over 60 days – users with no change held, users with increased positions bought, and users with decreased positions sold.
60 Day Wallet Behavior Airdrop Analysis
|
Less Than 10% Supply Airdropped |
10% or More of Supply Airdropped |
|
|
Core Users |
85.07% Hold 8.71% Buy More 6.22% Sell |
91.08% Hold 1.18% Buy More 7.74% Sell |
|
Widespread |
84.19% Hold 2.29% Buy More 13.51% Sell |
87.19%% Hold 0.75% Buy More 12.06% Sell |
We can draw two insights here:
1. Widespread Airdrops result in 2x more Sellers
The average data shows that recipients of widespread airdrops are 2x more likely to sell than core users.This is intuitive. If users receive a token for something they didn’t use before, or perhaps even have heard of, they are much more likely to swap it into an asset they care about. Perhaps even more telling, 8 of the 10 protocols with the highest percent of sellers did a “widespread” distribution.
2. Small Airdrops to Core Users result in 4-8x more Buyers
It’s statistically meaningful that the highest percent of Buyers occurs when the airdrop is small (< 10%) and geared towards core users. This is also intuitive, given that they are the most engaged and likely to buy tokens given their existing conviction and potential desire to participate in governance / VE liquidity votes.
Recommendations
Our analysis revealed four main insights:
- Airdropping to Core cohorts showed higher price two months after airdrop
- Airdrop size did not meaningfully affect price performance or volatility, meaning that the “low float” may be less relevant for price pump/dumps than other factors
- The Widespread airdrop cohorts experienced 2x more Sellers than the Core cohorts
- The Small Airdrops + Core Users cohort had 4-8x more Buyers (increasing their position)
We derive some general-purpose biases on airdrop design from the data, but it’s important to note that the specific context around the protocol and its goals must always be considered.
Recommendation #1: Bias Airdrops to Core Users over Widespread audiences
Given the opportunity cost of airdropping to users who are 2x more likely to sell, our first general outlook is that airdrops should primarily be to core users who help bootstrap liquidity and/or drive usage versus airdropping to a broader audience. Our intuition that rewarding Core Users will result in higher holder retention is validated by the data. The chance of converting non-users into users through an airdrop seems unlikely, and it’s often better to focus attention and funds towards galvanizing your core community. Airdropping to core users may also contribute to buying momentum and relatively higher prices.
Recommendation #2: Bias Smaller Airdrops over Larger
Given that size was not an outsized driver of price and volatility, we bias towards keeping airdrops smaller rather than larger. Tokens help bootstrap usage and liquidity, and especially if teams plan to continue iterating on their product (vs aim to enshrine it), keeping more in reserve helps fund future rewards to attract users and liquidity. Note, the airdrop should still be large enough to meaningfully reward early risk capital and act as a galvanizing moment for the community.
There may be exceptions where a larger airdrop is preferred. For example, larger airdrops can protect against vote centralization and make it more expensive for malicious actors to influence the network. That said, enabling team and investors to vote on their locked tokens may reduce this risk vector.
Observation: “Low-Float” likely isn’t the primary driver of volatile price performance
Lastly, more as an observation vs a recommendation, the data does not support the “low-float” theory being the primary culprit of large price action and volatility. Thinking through this logically, a low-float restrains the supply and should therefore drive prices higher. However, we observed no meaningful relationship between Large and Small airdrop cohorts, and all cohorts were lower in price 60 days after launch. In addition, analyzing relative volatility did not reveal a meaningful difference in airdrop size, even though we’d expect much higher volatility for a lower float. In fact, the Large + Widespread cohort had the highest volatility by a large margin!
If we had unlimited resources and knowledge, we’d expand our research to include assessing the TVL in protocols pre/post TGE to evaluate if airdrop size affects TVL stickiness, as well as looking at the ratio of TGE-price vs last major investment round.
APPENDIX
Crypto Index Correction
To perform a balanced analysis over different macro conditions, we used beta normalization to remove macro price changes from token price changes. This was done using a multiple regression with BTC and ETH, in which we remove the beta for each asset against macro and reconstruct prices once adjusted.